Tl;dr
This is highlights from my one hour presentation at HITB 2015 Conference in Amsterdam. Slides and full whitepaper can be downloaded at HITB website.
Why a publicly known honeypot system doesn’t do the job
A honeypot system must resemble a real system. This is a fundamental feature of any honeypot system. A publically known honeypot system can be fingerprinted by an attacker, hence it is incapable of tracking real intrusions.
Over past years, I’ve been developing a custom honeypot intelligence system called Smart Honeypot. I’ve been using Smart Honeypot to study different groups of attackers targeting different networks specifically intrusions that are targeted toward Cloud platforms.
Three principles in developing a honeypot system
Principle 1: Do not fake
Try to use a real network service as much as possible and avoid emulation.
Principle 2: Segregation of duties
A honeypot is a complex system that need to manage many tasks. Try to manage each task in a separate system.
Principle 3: Smart deployment
Use a previously used IP address to deploy a honeypot system. Try to have more than one honeypot system with in your selected network.
Experiment
13 Smart Honeypots were setup to cover all geographic regions of AWS and Google Cloud. Honeypots resemble a typical server with WEB and SSH access. The objectives were to study SSH attack chain, find attack profile for each geographic regions and find connection among attackers.
Objective 1: SSH attack chain
An in depth study of SSH attacks is dissected in this blog article.
Objective 2: Attack profile for each geographic region
An extensive analysis of attack profile for each regions of Cloud platforms is discussed in this blog article.
Objective 3: Find connection among attackers
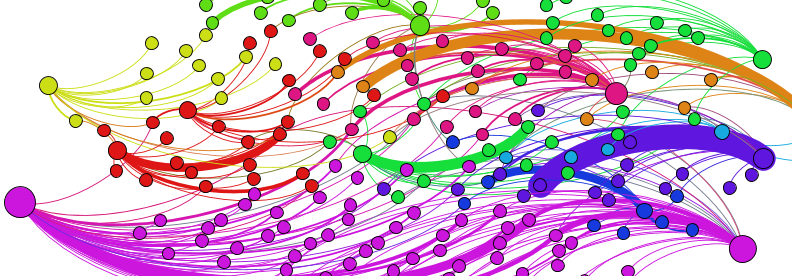
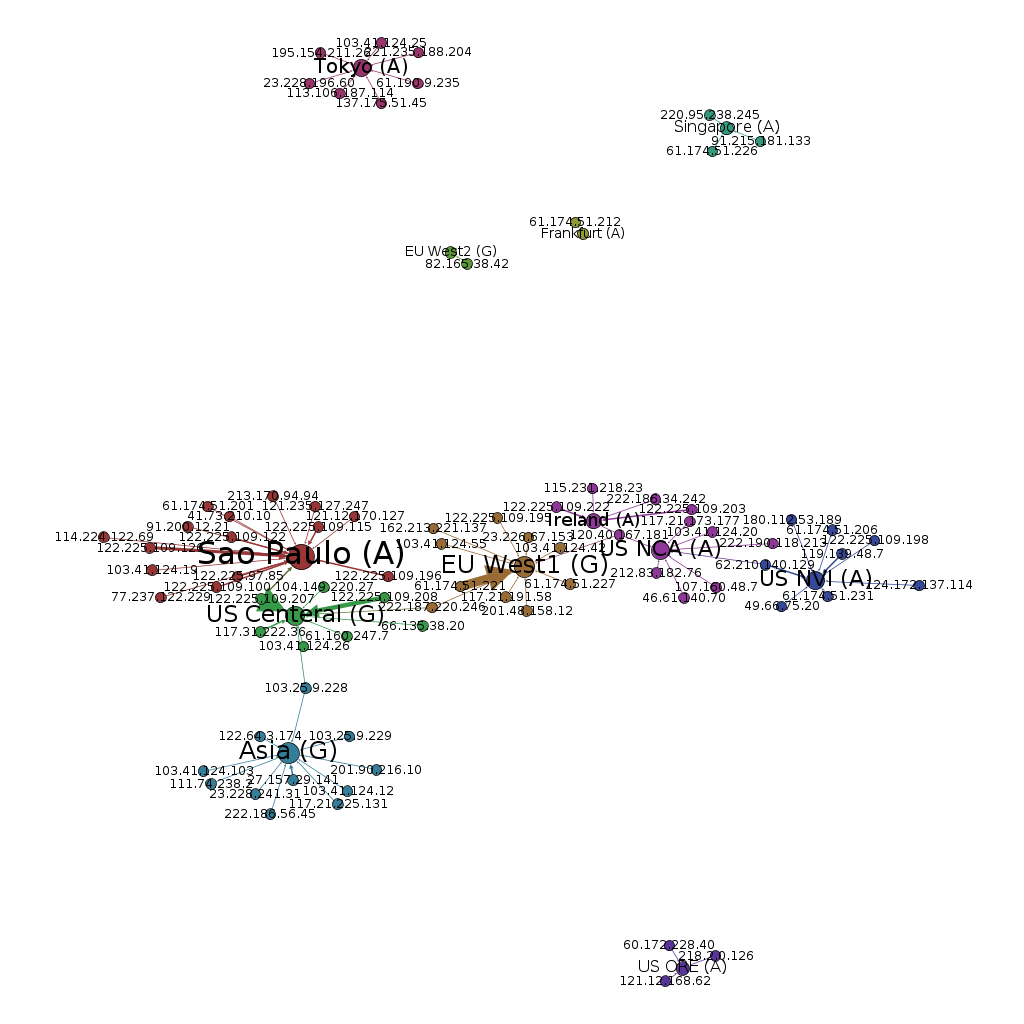
Network theory techniques were used to analyse the captured data. The following graph shows compromised honeypots in December 2014. Nodes that are bigger in size are honeypots in different geographic regions. The smaller nodes are attackers who compromised the host. Different colours are representative of different groups of attackers.
The interesting observation here is that attackers are unique to each geographic region and they are coloured the same around the targeted honeypot node. The graph also shows that there are very few attackers target more than one honeypot.
The following graph shows the connection among Infectors and Brute-forcers for the data collected over November 2014.
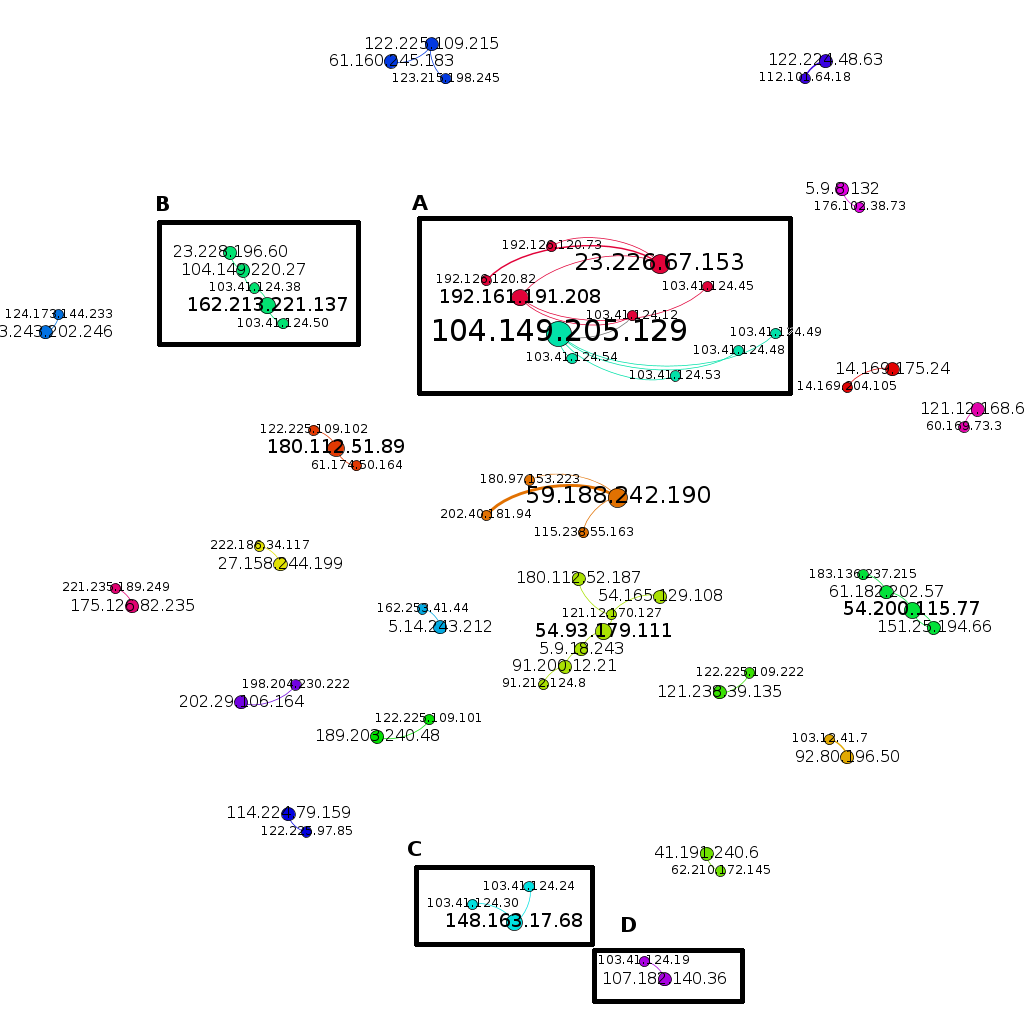
The nodes that are bolded are Infectors and the smaller nodes are Brute-forcers. In each cluster the number of Infectors are less than or equal to brute-forcers. For example, focusing on the node labelled as 104.149.205.129, there are 5 Brute-forcers connected to this node. This means, once any of these Brute-forcers guessed a correct credential, this infector used the credential to log into the honeypot, uploaded and executed a malware.
There is a path from the Infector mentioned above to another infector, 192.161.191.208 via 103.41.124.12, and there is also a path to another infector 23.226.67.153. This could possibly shows that 23.226.67.153 node orchestrated all the attacks with in this cluster.
In the following figure, I added Autonomous System Number (ASN) associated to each IP address on the previous graph.
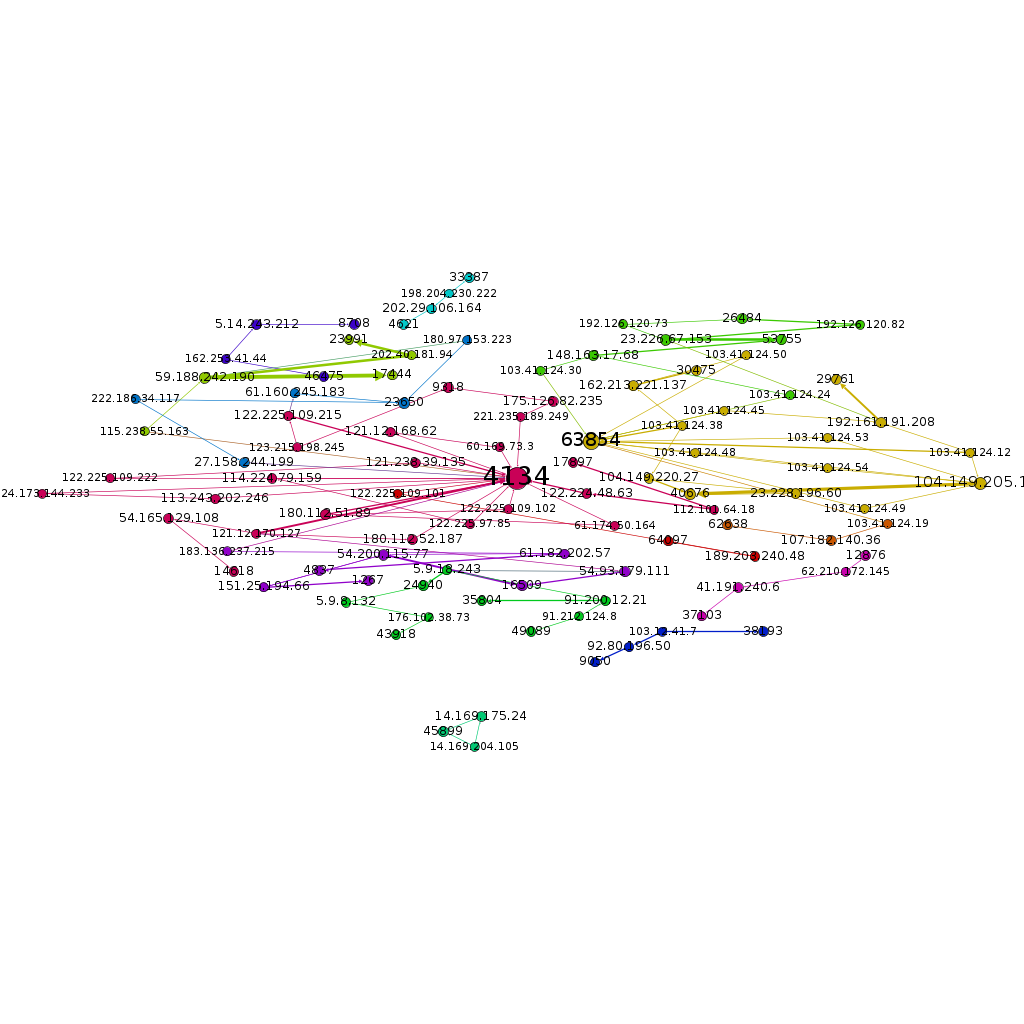
By adding ASN, most isolated clusters from previous graph are grouped together. This shows the majority of attacks were originated from a few network providers specifically ASN 4134 and ASN 63854. Moreover, Clusters A, B, C, and D are grouped into one cluster.
This cluster also shows another interesting point. Brute-forcer IP addresses of this cluster were owned by ‘Hee Thai Limited’ that is a Hong Kong based company. However, the Infectors’ IP addresses were owned by the following US based companies.
- Psychz Networks
- Input Output Flood LLC
- HostSpace Networks LLC
- WeHostWebsites.com
- QuadraNet Inc
- Query Foundry LLC
This observation can have two possible scenarios:
- Infectors (US) purchased a botnet in Hong Kong for brute-force attempts and distribute malware on compromised hosts; or
- A list of compromised hosts was traded to the Infectors (US) for distribution of malwares.
To investigate this, I looked at the time difference between the first brute-force attempt and the time when the first related Infector was observed in this cluster. The first brute-force (103.41.124.49) was observed on 21st of November and the Infector was observed on 28th of the same month. There is a week gap between the two actors which is unusual. On average, I see the Infector to connect to the compromised honeypot in less than a day.
This potentially support the second scenario that a list of compromised hosts was traded to the Infectors in US for distribution of malware.
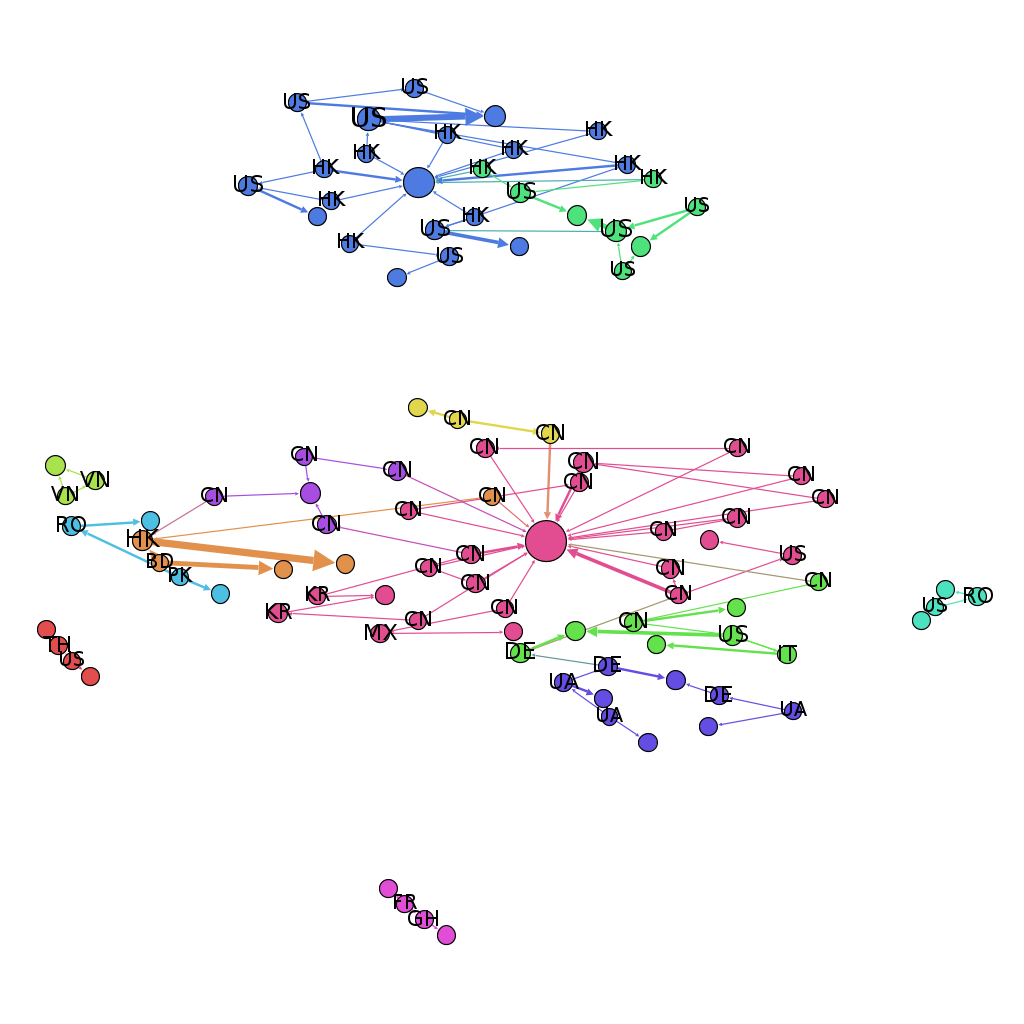
In the above figure, I replaced IP addresses with country names to show the connections more clearly. There are some other interesting associations e.g. Brute-force from Ukraine and Infector from Germany, Brute-force from China and Infector from Mexico etc.
If you are running or part of a CERT organisation, a VPS/Cloud/Hosting provider, or managing a university network, at the moment we offer our VIP plan to your sector. Click here to get your invitation.