Summary
The experiment highlights the correlation among sources and types of attacks across Amazon EC2 geographic zones (or regions) by using Smart Honeypots. The purpose is to identify whether choice of EC2 geographic region has an impact on risk profile of a Cloud-based host.
- With only 6% correlation on source of intrusions, 94% of intruders were unique to each zone.
- The attack profile between zones were completely different. Tokyo zone received significant number of NTP amplification intrusions, where Ireland suffered the most from SNMP scanning and N.Virginia from SSH brute-force attempts.
- Intruders targeting N.Virginia were mainly sourced from Russia and China, whereas Sydney zone received most intrusions from Netherlands.
- Except for DNS amplification intrusions that widely observed on all zones, intruders were only targeted a single zone.
- DNS amplification, SSH brute-forcing, VoIP, SNMP and UPNP scanning had the highest correlation across all zones.
- Ecatel and Firering (NL), OVH (France), Redstation (UK) and VolumeDrive (US) were top non-Chinese providers that allowed for their environment to be used for launching attacks.
- Read our recommendation (on the last page) on how to improve the security of your cloud instance by getting access to our cloud-based custom blacklist service.
Introduction
As part of on going Project Amazon EC2, I investigated the attack profiles across different EC2 geographic zones by using Smart Honeypot (SH). My objective was to make an attack profile for each EC2 zone and identify the correlation between source of intrusions. In particular, I wanted to discover if there is a limited set of IP addresses target EC2 Cloud instances across different geographic zones (which by the end of experiment it ended up being something completely different!).
Experiment setup
The following list shows details of the experiment:
- Number of SH Cloud instances: five (5)
- Start and end dates: 13 April to 23 May 2014
- Duration: forty (40) days
- EC2 geographic zones: Tokyo, Sao Paulo, North Virginia, Sydney and Ireland
- Cloud instance base image: Ubuntu 13.04 – EC2 micro instance
- IP addressing: Default IP address block per each EC2 zone
The AWS firewall was set to allow all the inbound connections so SH can observe and respond to all network traffics.
No domain names were mapped to SH public IP addresses and their addresses were not disclosed or advertised anywhere. Moreover, SHs across EC2 zones were all identical.
Observation
There was almost no correlation!
In total, 1927 unique IP addresses were collected during the experiment. Surprisingly there was only 6% correlation across different zones which means over 94% of threat actors were unique for each zone.
Correlation of intrusions
The following intrusion were targeted on all the SHs:
- DNS Amplification Attack (53/udp)
- SSH password brute-force attempts (22/tcp)
- Sipvicious Scan (5060/tcp)
- SNMP scan (161/udp)
- UPnP service discovery (1900/udp)
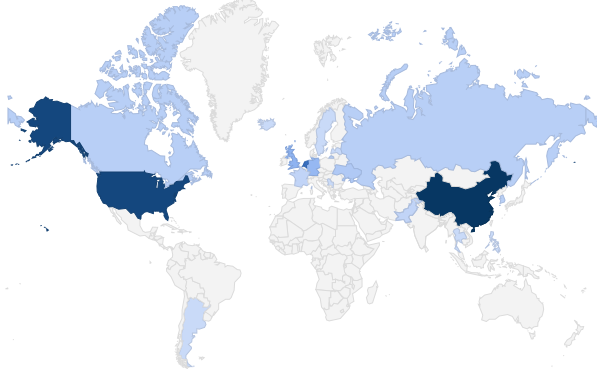
China, USA and Netherlands top origin of intrusions
Figure 1 illustrates countries where intrusions were originated. China, USA and Netherlands were on top three (3) countries. The interesting observation here was DNS amplification intrusions that were mainly originated from Netherlands IP addresses.
Chinanet, Ecatel and OVH providers with weak security
Below list details which provider involved in the majority of intrusions across all SHs
- Chinanet Backbone, China, ASN 4134
- Ecatel hosting provider, http://www.ecatel.info, Netherlands, ASN 29073
- OVH, http://www.ovh.com/, France, OVH 16276
- Fiberring networks, http://www.fiberring.com/, Netherlands, ASN 16265
- Redstation hosting provider, http://www.redstation.com/, UK, ASN 35662
- VolumeDrive hosting provider, http://volumedrive.com/, USA, ASN 46664
The weak security posture of these providers facilitated the execution of the majority of intrusions that were observed by SHs.
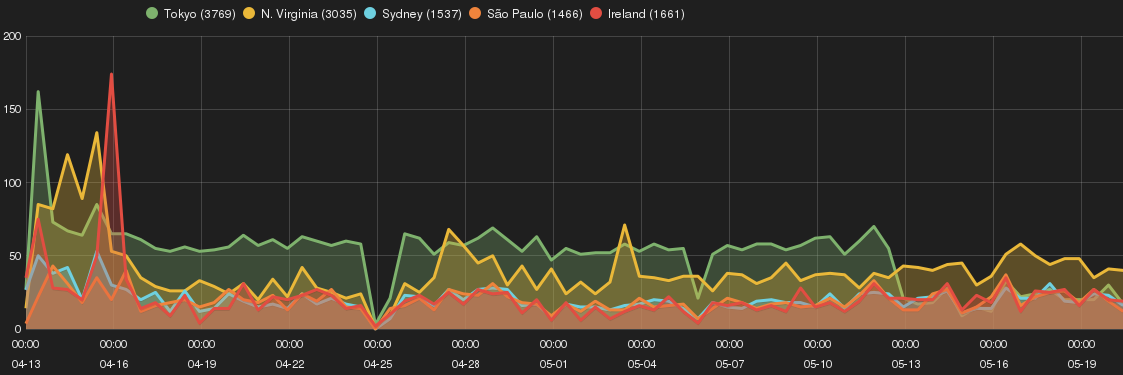
EC2 attack profile per each zone
Figure 2 illustrates number of intrusions per each SH. Tokyo SH received the most amount of intrusions following with N. Virginia and Ireland SHs. April 13 to April 17 showed large number of attempts on all SH. On April 25th there was a network connectivity issues with the data aggregator cluster servers and I didn’t collect the data for that day (it is a real world experiment and these things happens!).

For the remaining part of this section, I summerise SH’s attack profile per each EC2 zones. By only glancing over zone figures, you can see each SH have completely different attack trend. Before getting into the details, I should also remind the following note:
The reader should be reminded that the country and ownership information were collected only by looking at the registration information (i.e. whois) of the intruder IP address and it should not perceived as the intrusions are orchestrated by a particular nation. A computer savvy person is aware of the fact that source IP addresses can be easily spoofed.
Tokyo
Figure 3 shows a trend of intrusions and targeted network services on Tokyo SH.
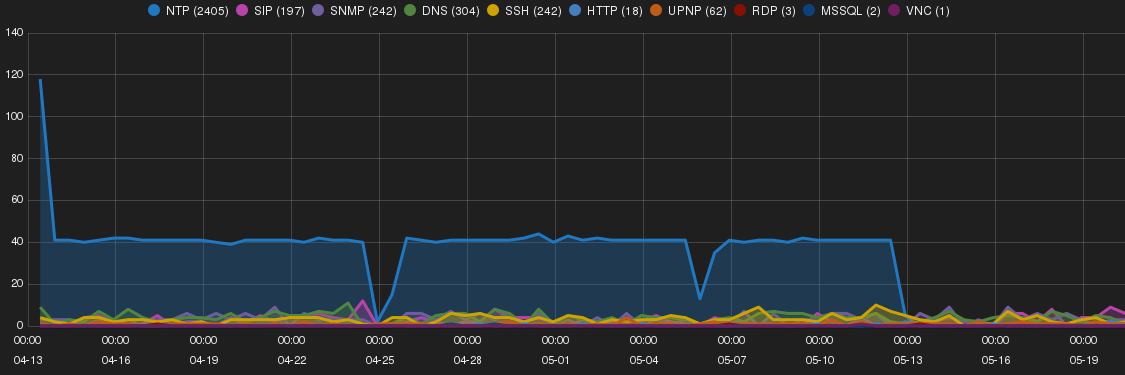
NTP amplification and Tor-originated intrusions
There was significant amount of NTP amplification intrusions targeting Tokyo SH. The attempts were steady for over a month with average of 40 attempts per day.
The majority of NTP amplification intrusions attempts were originated from Tor exit nodes.
Top intruder was 219.117.206.46, sylph.white-void.net owned by Interlink Co.
N. Virginia
Figure 4 shows a trend of intrusions and targeted network services on N. Virginia SH.
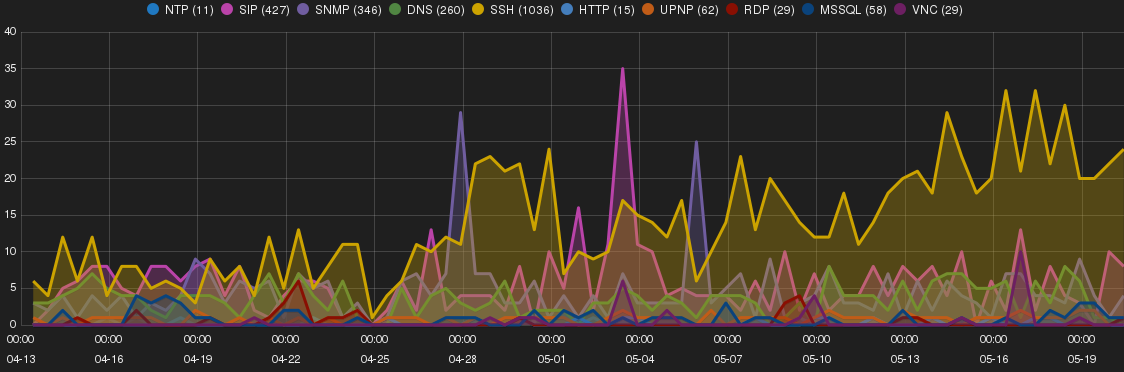
Chinese and Russians IPs were behind most intrusions
SSH brute-forcing attempt was dominant on N. Virginia SH. In particular it increased toward the end of the experiment. The majority of the attempts was sourced from 116.10.191.1/24 (e.g. 116.10.191.226, 116.10.191.190, 116.10.191.187, 116.10.191.231) subnet that owned by Guangxi data comm.Bureu, China, ASN 12695. Interestingly there was no intrusion from this subnet on other SHs.
SIP scan was sourced from 95.163.121.1/24 (e.g. 95.163.121.175, 95.163.121.173, 95.163.121.17, 95.163.121.165) owned by Digital Network JSC, http://www.msm.ru, Russia, ASN 35662. Similarly to SSH brute-forcing there was no intrusion observed from this subnet on other SHs.
93.180.5.26 was among many other intruders conducting a wide DNS amplification intrusions. The intrusions from this source was also recorded on other SHs. The IP address belongs to Moscow State University, Russia, ASN 2848. The intruder host found to have port 22, 80 and 443 open. Throughout the experiment the host’s SSH service banner changed from OpenSSH 5.3 protocol 2.0 to OpenSSH 6.6p1-hpn14v4 protocol 2.0.
50.202.126.166 (50-202-126-166-static.hfc.comcastbusiness.net) owned by Comcast Cable Communications (http://business.comcast.com/) performed a large number of SNMP probing on N. Virginia SH.
Vulnerable versions of PHPMyAdmin were constantly accessed by 202.202.113.159 (Chinese Southwestern Agricultural University). Surprisingly, there was no attempt to exploit these vulnerabilities.